BASIC DATA
Mountain Lifeworks believes in empowering people of all abilities to help themselves, their neighbors and community. Data indicates that individuals with disability are 3X more likely to live in poverty and earn median incomes 33% less than peers with a disability. At same time data reveals the poverty rate is higher among families with a member with a disability than among families without in ALL 50 STATES.
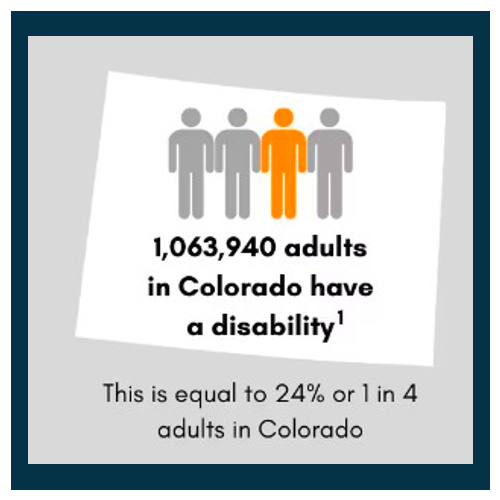
- 1,063,940 or 24%
of adults in
- Annual increase of 48,005 reported JULY 2024 up from 1,015,417. (CDC)
- Annual increase of 163,821 reported JULY 2023 up from 851,596. (CDC)
- In 2020 and 2021
the poverty rate for working age adults with a disability was 25%
compared to 9.3%.
- Half (50%)
Data Shows Over 70 Million U.S. Adults Have a Disability | CDC
Disability Employment Statistics | U.S. Department of Labor (dol.gov)
Top 10 Conditions That Qualify For Disability | (disabilitybenefitscenter.org)
Report finds nearly half of accommodations for disabled workers have no cost | (dol.gov)
AVERAGE DATA
Mountain Lifeworks understands the distinction between average and specific costs and unemployment rates. Data shows average disability unemployment rates are DOUBLE the non-disabled, while category specific disabilities have unemployment and poverty rates 5X to 8X the average. By tracking poverty, employment and benefit enrollment among those facing the greatest disparities we help reduce both annual average and long-term cost.
unemployment - Persons with disabilities are unemployed at 2X the rate of those without a disability (US Dept. of Labor)
poverty rates - People with disabilities live in poverty at more than TWICE the rate of non-disabled (National Council on Disability)
healthcare costs - annual
average of $15,935 per person in CO with a disability (CDC)
working age costs - 18
to 65 (47 years) equals $748,945
U.S. State Profile Data: Adults | (DHDS) | CDC
Disability and Health Healthcare Cost Data | CDC
People with Disabilities | NAMI

ADDITIONAL DATA
Data shows 34% of households that earned
above the Federal Poverty Level (FPL) struggle with the cost of
basic necessities. This means in spite of being employed they cannot
afford the essentials in the communities where they live. These
households are: Asset Limited, Income Constrained, Employed (ALICE).
Between families in poverty and ALICE, 51% or more of all people
with disabilities in Colorado and the
2024 Infographic | Disability Compendium
The CDC tracks 6 categories of disability, and cognition is the leading category in Colorado and the USA. Cognition is the largest and fastest growing category and includes mental health conditions like depression and neurodiverse diagnosis like Autism. Increasing prevalence of cognitive diagnosis influences healthcare costs 4.1 times to 6.2 times the average annual disability costs.
unemployment - about 50% of twenty-five-year-olds with ASD have never held a paying job over 80% of those with neurodiversity are under or unemployed at or below poverty levels.
poverty rates - people with autism who used state-funded vocational rehabilitation programs only 60% left the program with a job Of these, 80% worked part-time at a median weekly rate of $160, putting them below the poverty level.
healthcare costs
- annual ASD category costs range from $65,333.50 at 4.1X to
$98,797
Advancing Employment of Young Adults with Autism (dol.gov)