BASIC DATA
Mountain Lifeworks believes in empowering people of all abilities to help themselves, their neighbors and community. Recent US Census Special Report data revealed families in which one member has a disability have median incomes more than 15% lower than non-caregiving families. At same time the poverty rate is higher among families with members with a disability than among families without in ALL 50 STATES.
- 1,015,417 or 23%
of adults in
- An increase of 163,821 from the prior report of 851,596. (CDC)
- In 2020 and 2021
the poverty rate for working age individuals with a disability was
25% compared to 9.3% for non-disabled.
Disability Employment Statistics | U.S. Department of Labor (dol.gov)
Top 10 Conditions That Qualify For Disability (disabilitybenefitscenter.org)

AVERAGE DATA
Mountain Lifeworks understands the distinction between average disability costs and unemployment rates compared to category specific costs and unemployment rates. Data shows average disability unemployment and poverty rates are DOUBLE the non-disabled, while category specific disabilities have unemployment and poverty rates 5X to 8X the average. By targeting enrollment among the largest groups and the highest costs a balanced approach helps reduce the annual averages and long-term costs.
unemployment - Persons with disabilities are unemployed at 2X the rate of those without a disability (US Dept. of Labor)
poverty rates - People with disabilities live in poverty at more than TWICE the rate of non-disabled (National Council on Disability)
healthcare costs - annual
average of $15,935 per person in CO with a disability (CDC)
working age costs - 18
to 65 (47 years) equals $748,945
Disability & Health U.S. State Profile Data: Colorado | CDC
Disability and Health Healthcare Cost Data | CDC
CATEGORY DATA
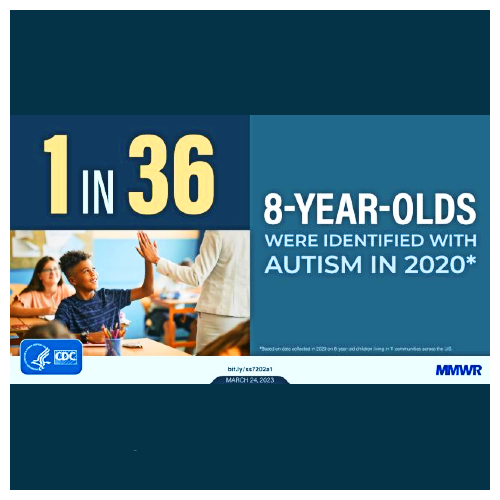
The CDC tracks 6 categories of disability, and cognition is the leading category in Colorado and the USA. Cognition encompasses an array of diagnosis including neurodiversity and Autism. Category specific data shows ASD has healthcare costs 4.1 times to 6.2 times the average annual disability costs.
unemployment - about 50% of twenty-five-year-olds with ASD have never held a paying job over 80% of those with neurodiversity are under or unemployed.
poverty rates - people with autism who used state-funded vocational rehabilitation programs only 60% left the program with a job Of these, 80% worked part-time at a median weekly rate of $160, putting them below the poverty level.
healthcare costs
- annual ASD category costs range from $65,333.50 at 4.1X to
$98,797
Advancing Employment of Young Adults with Autism (dol.gov)