2024 YEAR IN REVIEW
Most of the disparities we identified can be
resolved by recognizing and addressing distinctions between
accessibility for those with mobility disabilities and
accommodations for all disabilities. However, ignoring the
facts does not mean they cease to exist. Accessibility often refers
to structural modifications made for wheelchair users and other
mobility challenges. Public accommodations refer to modifying policy
or practices to facilitate equal access to participate, including in
state and local government programs, services and activities for all
disabilities. BLS data reveals over 50% of all accommodations cost
$0. This either reveals opinions and policies ignore the data and
economics or it exposes
barriers to inclusion and bias resulting in disparate treatment
and impacts against causes they deem undeserving or people they dislike.
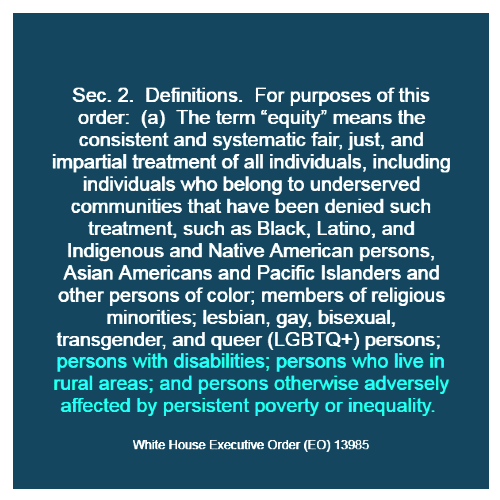
Over the past three years we have documented the expanding urban-rural gaps, and lack of equal opportunities and protections under existing civil rights laws… including equal access to the courts, employment, housing, healthcare, small business programs, and more. Mounting statistical evidence indicates political agendas exploit emotions and misrepresent data to justify funding DEI and ESG programs that lack any supporting federal legislation or requirements. Unlawful state and local DEI policies have exploited the staggering disparities facing those with disabilities, chronic medical diagnosis, neurodiversity, and mental health conditions to justify DEI funding... then use the same unlawful EDI policy to justyfy by-passing federal requirements and civil rights laws to prioritize funding select groups at the expense of all protected groups equitably.
Ending Illegal Discrimination And Restoring Merit-Based Opportunity – The White House
2024 YEAR IN REVIEW
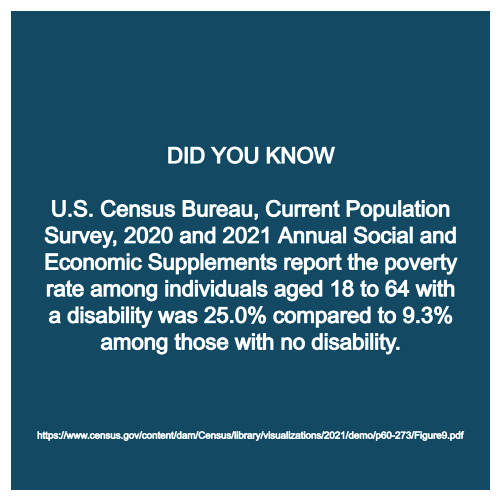
Let's review the statistical evidence politicians, charities and corporations continue to ignore. Again, this is not our data. We simply collect and organize data collected and published by government agencies and NPOs. Disability Impacts All of Us while other equity causes categorize communities by race, gender, orientation, etc. The fact remains that households in relative poverty have 70% greater occurrence of mental distress than wealthier households. Meanwhile, the poverty rate is higher in all 50 states and DC among families with a disability compared to families without.
2X the disability
unemployment rate versus those with no disability
8X
3X the poverty rate for disablilities versus those with no disability
11X the small business disparities versus other minority groups with no disability
3X the rate of depression versus those with no disability
5X the rate of frequent mental distress versus those with no disability
3X the average suicide rate versus those with no disability
9X autism suicide rate versus those with no disability
2024 YEAR IN REVIEW
CORA requests and other data reveals
state and local governments spend significantly on select pride /
heritage causes at the expense of all deserving causes based on
emotions and personal relationships... disregarding federal law and
statistical evidence. The Civil Rights Act, Equal Pay Act, and
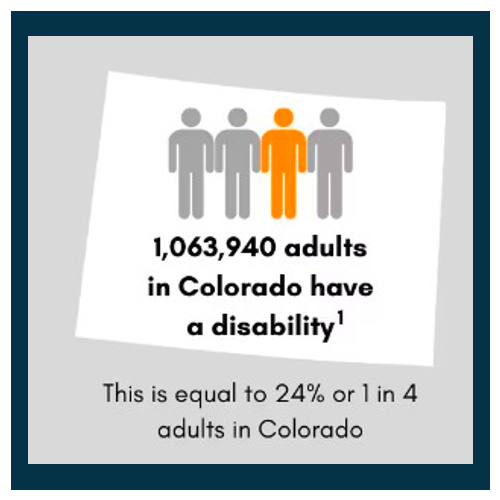
The CDC reports 1 in 4
adults in
Pride and heritage months: How much do Americans know? | YouGov
Caregiver Statistics | Family Caregiver Alliance
Equal access, opportunities and protections for those with visible and invisible disabilities are not threats to other minorities or lawful DEI policy. In fact we contend disability inclusion protects lawful DEI policies. Equal access, opportunities and protection is not special treatment. No one is suggesting canceling lawful DEI policies or defunding current organizations. However, the facts and years of statistical evidence clearly expose a pattern of disparate treatment and impact. Facts are metrics of performance not personal or political attacks. It is time State and local governments accept their responsibilities under federal law and ensure the equitable allocation of resources based on the statistical evidence and existing laws in 2025.
Fact checking
local governments, politicians and corporate social media feeds
you can see what causes they promoted and funded, compared to those
they omitted and ignored. Again this past year local governments,
politicians and corporations provided significant financial
contributions and in-kind support to a variety of ESG and DEI causes
from pride and heritage months to anniversaries to observances. At
the same time... there was little recognition of the Anniversary of the
We will continue to be the messenger, seek
willing allies and advocate for fair representation and economic
inclusion this year and every year!